
 |
Versione italiana |
Introduction1
The Food and Agriculture Organization of the United Nations (Fao) recently revised information on trends in global Ghg emissions from agriculture, forestry and other land uses (Afolu), and was the first to release global Afolu emissions data for 2012. According to Fao, the share of Afolu emissions to the anthropogenic total has declined over the 1990-2012 period. While agriculture emissions continue to increase annually, they are not growing as fast as emissions from fossil fuel use in other sectors. Thus, the share of Afolu to total anthropogenic emissions is steadily decreasing over time. In addition, new data from the Forest Resources Assessment 2015 (Fra) was used to estimate trends in net CO2 emissions and removals from forest land, including from net forest conversion (used as a proxy for deforestation) and forest remaining forest. These findings confirm an overall reduction in emissions from land use due to decreased deforestation, accompanied by a significant increase in emissions from forest degradation, which for the first time have been assessed separately from emissions from forest regrowth.
Recent Updates and Significant Findings: Global Ghg Emissions from Afolu
Fao provides emissions estimates for nearly 200 countries via the Faostat Emissions database, which covers all Afolu activities and their associated emissions, following Ipcc 2006 Guidelines at Tier 12 and land approach 13 for the reference period 1961-2012 (agriculture) and 1990-2012 (forestry and other land uses). These estimates are based on activity data collected by Fao via statistical surveys. For the first time, Fao provided this data to Working Group III of the Intergovernmental Panel on Climate Change (Ipcc) for use in the Fifth Assessment Report (AR5) on the State of Climate Change. Faostat also includes emissions estimates from biomass fires, peatland drainage and fires based on geo-spatial information, as well as forest carbon stock changes based on national-level Fao Forest Resources Assessment (Fra) data. The Edgar (Emissions Database for Global Atmospheric Research) database covers all Ipcc sectors (Energy, Transport, Industry, Buildings, and Afolu), applying 2006 Ipcc Guidelines for emission estimation (Edgar, 2015). Here, it was used to draw emissions from other sectors, and subsequently to estimate total anthropogenic emissions and perform cross-sectoral synthesis.
Trends in global Afolu emissions from 1990-2010 are as follows: Decadal average agriculture emissions grew from 4.6-5.1 Gt CO2 eq yr-1 in the 1990s, to 5.0-5.5 Gt CO2 eq yr-1 in the 2000s, reaching 5.2Gt CO2 eq yr-1 in 2010 (Figure 1). In contrast, decadal average forestry and other land use emissions declined, from a range of 5.7-6.8 Gt CO2 eq yr-1 in the 1990s, to a range of 4.9-6.5 Gt CO2 eq yr-1 in the 2000s, reaching 4.9 Gt CO2 eq yr-1 in 2010 (Tubiello et al., 2015).
Figure 1 – Global Agriculture Emissions Trends: 1990-2010
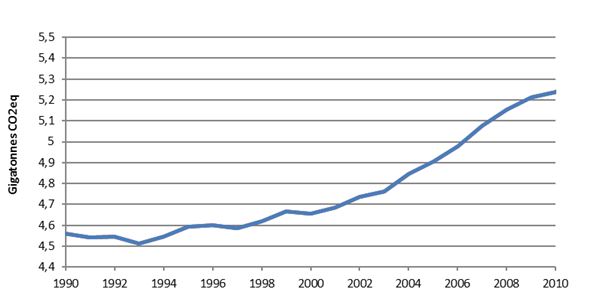
Fonte: Faostat, 2015
Fao was the first to publish emissions estimates for the year 2012. Globally, emissions from agriculture (crops and livestock) continued to increase by almost 100% in the last fifty years, rising from 2.7 Gt CO2 eq yr-1 in 1961 to 5.4 Gt CO2 eq yr-1 in 2012. There was a minor slowing in the growth rate of agriculture emissions in 2012 compared to the past decadal average, but it has remained roughly 1% annually. The top agriculture emissions categories in 2012 were Enteric Fermentation (40%), followed by Manure left on pasture (16%), Synthetic fertilizers (15%), and Paddy Rice (10%).
The data indicate a decadal average Afolu share of 28.7±1.5% in the 1990s, 23.6±2.1% in the 2000s, and an annual value of 21.2±1.5% in 2010. Thus, in previous decades, emissions from land use were significantly larger than those from agriculture (crop and livestock production). However, in 2010, agriculture was the larger component, contributing 11.2% of total Ghg emissions, compared to 10% in the land use sector. Deforestation was responsible for only 8% of total anthropogenic emissions in 2010, compared to 12% in the 1990s.
Figure 2 – Shares of Anthropogenic Emissions

Fonte: Tubiello et al (2015)
Regional agriculture emissions grew the fastest in Asia, where 2012 emissions were 2.5 Gt CO2eq yr-1, while in North America and Africa, emissions from agriculture decreased by -0.7% and -1.3%, respectively. In Asia, emissions grew to 46% in 2012 from an average of 44% over the 2001-2010 period. Africa and Latin America remained steady between the 2001-2010 period and 2012, with 15% and 17%, respectively. In contrast, emissions decreased in 2012 by 1% in both Europe and North America to 11% and 7%, respectively. ([pdf])
The most striking Faostat update for the year 2012 was the sharp increase in synthetic fertilizer use. Emissions from synthetic fertilizers grew 5.6% in 2012, compared to a decadal average growth rate of 3.8% over the 2001-2010 period. The greenhouse gas associated with synthetic fertilizers is N2O, which has a global warming potential (GWP) of about 300 times that of CO2. This recent increase in synthetic fertilizer use highlights the necessity of non- CO2 mitigation, which may also be linked to increased input use efficiency and lower environmental pollution.
In addition, new 2015 Fra data were obtained from each Country Report for the 1990–2015 period, and include estimates of forest area and of carbon stocks in both aboveground and belowground biomass carbon pools. The input data are produced by each country according to Fra guidelines, and include area and biomass data that use ground-based and aerial measurements. It is important to note that these are not directly analogous to measurements made using satellite imagery. Trends in land-use change areas based exclusively on satellite data can be quite different than those presented in this paper4.
These data indicate a decrease of more than 25 percent in total carbon emissions from forests between 2001 and 2015, due to a slowing in global deforestation rates. Specifically, global emissions from deforestation have declined from 3.9 to 2.9 Gt of CO2 per year over the period 2001-2015 (Fao, 2015). Deforestation is defined as a land-use change from forest to other land uses. Forest degradation is defined as a reduction in tree biomass density from human or natural causes, or as a net annual decrease of carbon stock density in land remaining forest. For the first time ever, Fao’s data include a separate assessment of emissions from forest degradation and removals from forest regrowth. Despite the fact that the overall reduction in emissions is linked to decreased deforestation, emissions from forest degradation have significantly increased during the same time period, from 0.4 to 1.0 Gt CO2 per year (Fao, 2015).
While deforestation contributes to net emissions, remaining forests continue to be a net carbon sink globally, having stored 2.1 Gt of CO2 average annually during the period 2011–2015. According to Fao estimates, 50% of the estimated sink was due to net growth in planted forests. If contributions from deforestation and forest sinks are combined, then forests represent a net source of emissions with an average of 0.8 Gt of CO2 per year during the period 2011–2015. This is an emissions reduction of over 50% compared to the decade 2001–2010, which generated average net forest emissions of 1.7 Gt of CO2 (Fao, 2015).
At the regional level, Africa, Asia and Latin America and the Caribbean all continued to be net sources of emissions from forests, although emissions from Africa and Latin America and the Caribbean decreased over the period 1990–2015. Developed countries continued to represent the bulk of the overall carbon sink, or 60% of the total, during 2011–2015. This share has declined from 65% during 2001–2010, owing to decreases in new forest area plantations. Brazil represented more than 50% of the overall estimated emissions reductions during 2011–2015, with a decrease of almost one-third in net deforestation between 2005 and 2006, and a 50% decrease between 2010 and 2011.
These updates provide important evidence that forest degradation plays a critical role in land use emissions, and should be considered when planning climate change mitigation activities. To this end, restoration and conservation measures must not be underestimated when planning a course of action to address climate change.
Conclusive remarks
The assessment of historical and current trends in Ghg emissions is important for both science and policy. Highly refined data assist in improving classification of anthropogenic climate forcing, resulting in a more profound understanding of climate change while also raising awareness and providing support for global action via policy instruments. These results may better inform the current climate policy debate on land use, while suggesting that greater effort and additional resources be directed toward agriculture mitigation activities in the near future, as they have been devoted to Redd+ during the past decade.
References
-
Edgar (2013), Emissions Database for Global Atmospheric Research (Edgar), available at link [link]
-
Fao (2015), Fao Assessment of forests and carbon stocks, 1990-2015. Rome, Fao. Available at link [pdf]
-
Ipcc (2003), Good Practice Guidance for the Land Use, Land Use Change and Forestry sector, Prepared by the National Greenhouse Gas Inventories Programme, Jim Penman, Michael Gytarsky, Taka Hiraishi, Thelma Krug, Dina Kruger, Riitta Pipatti, Leandro Buendia, Kyoko Miwa, Todd Ngara, Kiyoto Tanabe and Fabian Wagner. (Eds), Iges, Hayama, Japan. Available at [link]
-
Ipcc (2006), 2006 Ipcc Guidelines for National Greenhouse Gas Inventories, Prepared by the National Greenhouse Gas Inventories Programme, Eggleston H.S., Buendia L., Miwa K., Ngara T. and Tanabe K. (Eds), Iges, Hayama, Japan. Available at [link]
-
Kim D.-H., J. O. Sexton, andJ. R. Townshend (2015), Accelerated deforestation in the humid tropics from the 1990s to the 2000s, Geophys.Res. Lett., 42, doi:10.1002/2014GL062777
-
Smith P., Bustamante M., Ahammad, et al. (2014) Agriculture, Forestry and Other Land Use (Afolu). In: Climate Change 2014, Mitigation. Contribution of Working Group III to the Fifth Assessment Report of the Intergovernmental Panel on Climate Change. Edenhofer, O., R. Pichs-Madruga, Y. Sokona, E. Farahani, S. Kadner, K. Seyboth, A. Adler, I. Baum, S. Brunner, P. Eickemeier, B. Kriemann, J. Savolainen, S. Schlömer, C. von Stechow, T. Zwickel and J.C. Minx (eds.). Cambridge University Press, Cambridge, UK and New York, NY, Usa
-
Tubiello F. N., Salvatore M., Ferrara A. F., House J., Federici S., Rossi S., Biancalani R., Condor Golec R. D., Jacobs H., Flammini A., Prosperi P., Cardenas-Galindo P., Schmidhuber J., Sanz Sanchez M. J., Srivastava N. and Smith P. (2015), The Contribution of Agriculture, Forestry and other Land Use activities to Global Warming, 1990–2012. Global Change Biology. doi: 10.1111/gcb.12865
-
Faostat Emissions database Agriculture: [link]
-
Faostat Emissions database Land Use: [link]
-
Faostat Greenhouse Gas Emissions from Agriculture, Forestry, and Other Land Use, Global Infographic, Available at link: [pdf]
- 1. Disclaimer: The material and opinions expressed herein are solely those of the authors and cannot be taken in any way to represent the official view of Fao on the subject.
- 2. According to the 2006 Ipcc Guidelines for National Greenhouse Gas Inventories: A tier represents a level of methodological complexity. Usually three tiers are provided. Tier 1 is the basic method, Tier 2 intermediate and Tier 3 most demanding in terms of complexity and data requirements. Tiers 2 and 3 are sometimes referred to as higher tier methods and are generally considered to be more accurate. Default data: Tier 1 methods for all categories are designed to use readily available national or international statistics in combination with the provided default emission factors and additional parameters that are provided, and therefore should be feasible for all countries.
- 3. According to the Ipcc Good Practice Guidance for Lulucf: Approach 1 identifies the total area for each individual land-use category, but does not provide detailed information on changes of area between categories and is not spatially explicit other than at the national or regional level. Approach 1 is probably the most common approach used at present for preparing estimates of emissions and removals under Ipcc Guidelines categories 5A-5E. It uses area datasets likely to have been prepared for other purposes such as forestry or agricultural statistics.
- 4. Kim et al estimated a 62% acceleration in the humid tropics from the 1990s to 2000s using a consistent, 20-year series of high-resolution (30m) satellite-based forest cover maps from 34 tropical countries that account for the majority of the global area of humid tropical forests.